Route Graph Generation
Overview
This tutorial walks a user through generating a graph for the nav2 route server.
Requirements
Follow https://www.qgis.org/en/site/forusers/download.html to install QGIS.
Tutorial Steps
1- Create New QGIS Project
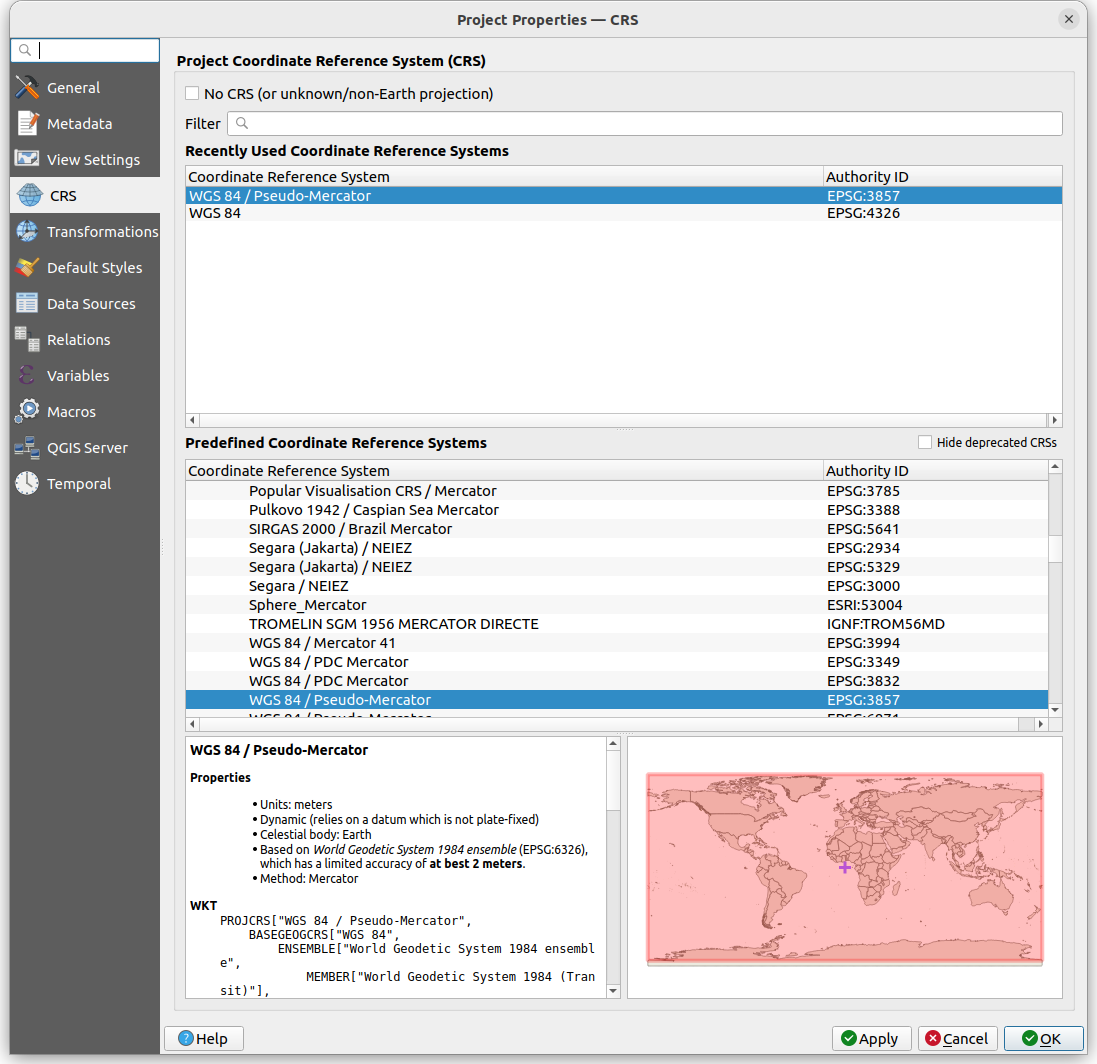
Open QGIS and create a new project by selecting Project->New. Save your project by selecting, Project -> Save As. Set the project coordinate reference system by selecting Project->Properties->CRS. Set the coordinate system to WGS 84 / Pseudo-Mercator and click OK.
Note
The WGS 84/ Pseudo-Mercator is one of few coordinate systems that could be used. For more information about coordinate reference systems please review https://docs.qgis.org/3.22/en/docs/gentle_gis_introduction/coordinate_reference_systems.html.
2- Setup Coordinate System
By default, the imported raster image origin will be at the top left corner, with x pointing to the right, and y pointing up. To correctly set the origin and the resolution we will georeference the raster image. To georeference the image, three control points will chosen. Each control point maps a pixel location to the spatial reference.
For example, let’s say you have a 100 by 200 raster image with a resolution of 0.05 and a origin in the bottom left corner.
The first control point we could select is (0, -200)px -> (0, 0)m. (0, -200)px is the bottom left corner in the pixel frame and (0, 0)m is coordinates in the spatial frame.
This is the convention of our ROS maps, typically.
For the second control point we will select the top left corner of the image as the original (0, 0)px. The associated coordinates in the spatial frame can be calculated by using the resolution
to convert the pixels to meters. In this case, (0, 0)px -> (0, 10)m. Where 10 m is 200 px* 0.05 m/px. The last control will be the bottom right corner: (100, -200)px -> (5, 0)m.
It is recommended to set the origin of your map to the lower left corner of the image ([0.0, 0.0, 0.0] in your map.yaml), to make this process easier.
To georeference image select Raster -> Georefencer. Set the Transformation Settings to Linear for Transformation type, WGS 84/ Pseudo-Mercator for Target SRS and set your desired path for the Output Raster.
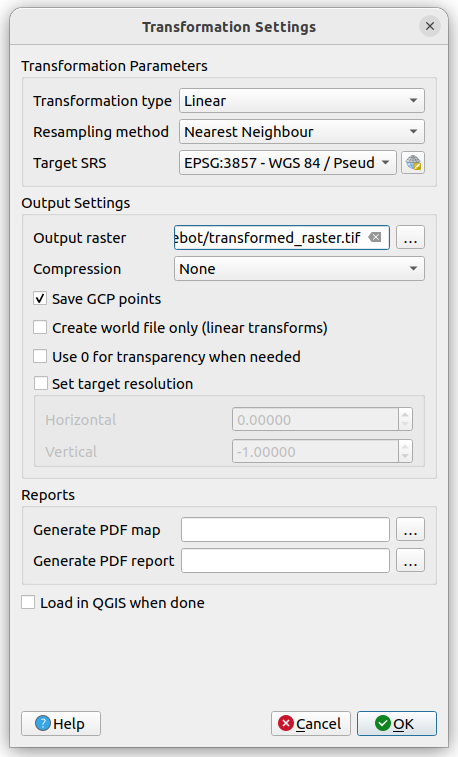
Select the raster image you wish to georeference and place control point by selecting Add Point and clicking on the raster image. The control points can be modified by clicking on the control point table and typing in new values. Once you are satisfied with your control points, apply the transformation by selecting Start Transformation.
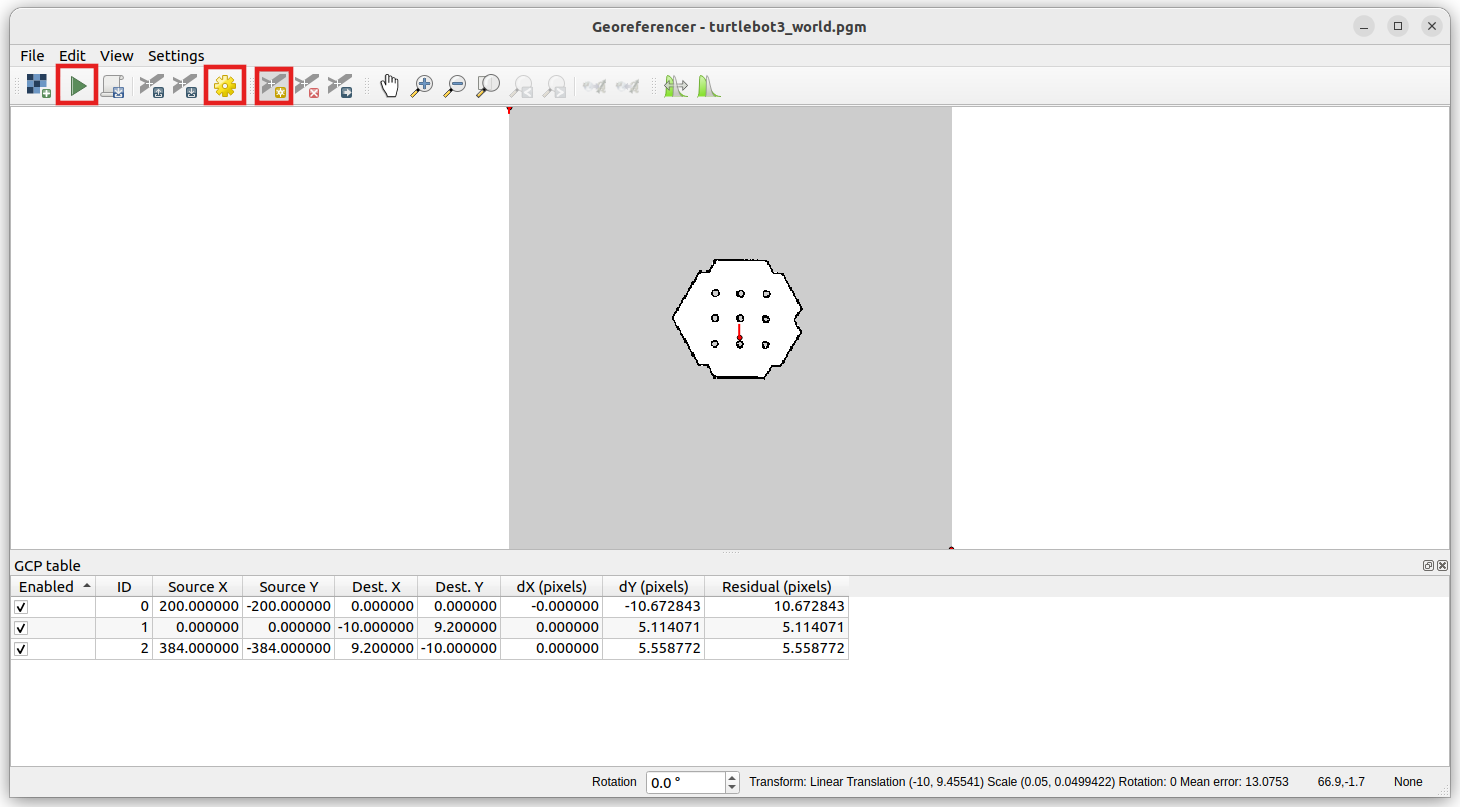
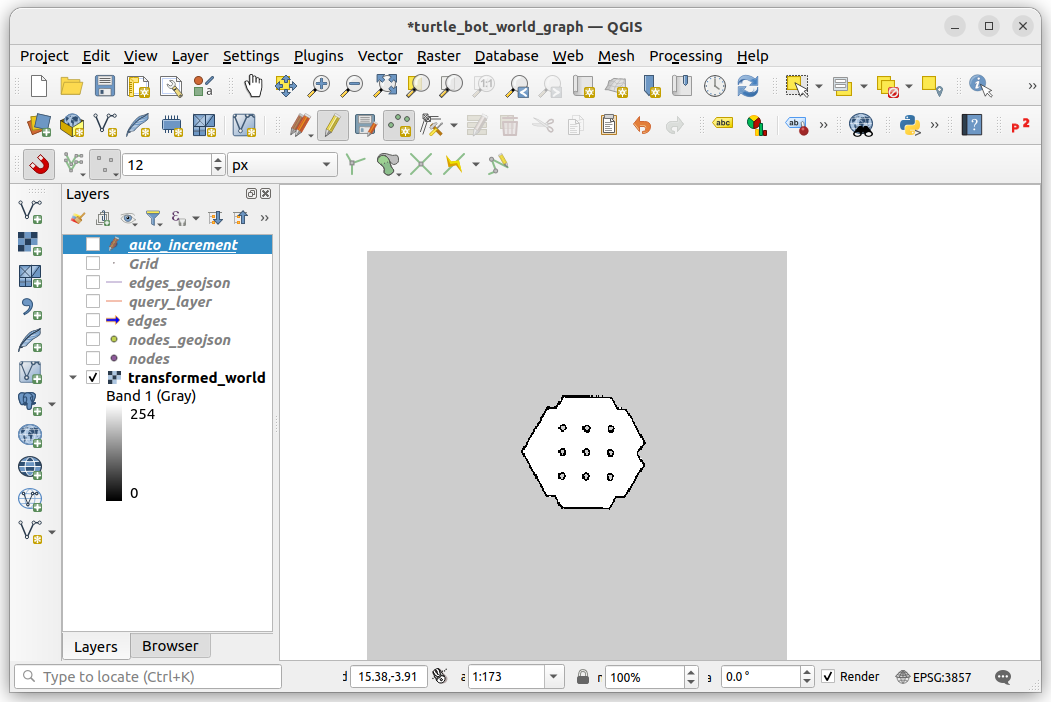
Close the window. Drag and drop the georeferenced raster file that was just created into the layers window. This should be a tiff file, by default.
To verify the transformation worked, move the mouse around the raster image and look at the coordinates being displayed at the bottom of the window.
3- Add Nodes
Now that we have georeferenced the raster layer we can start placing nodes.
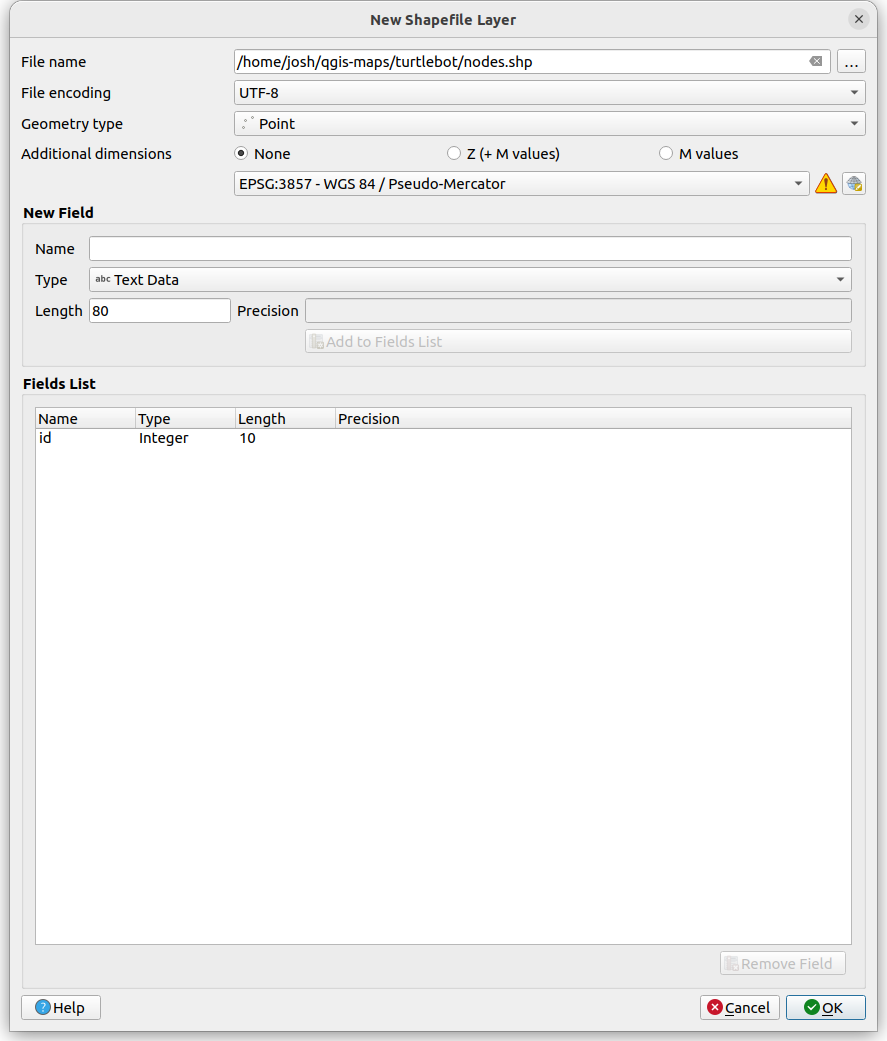
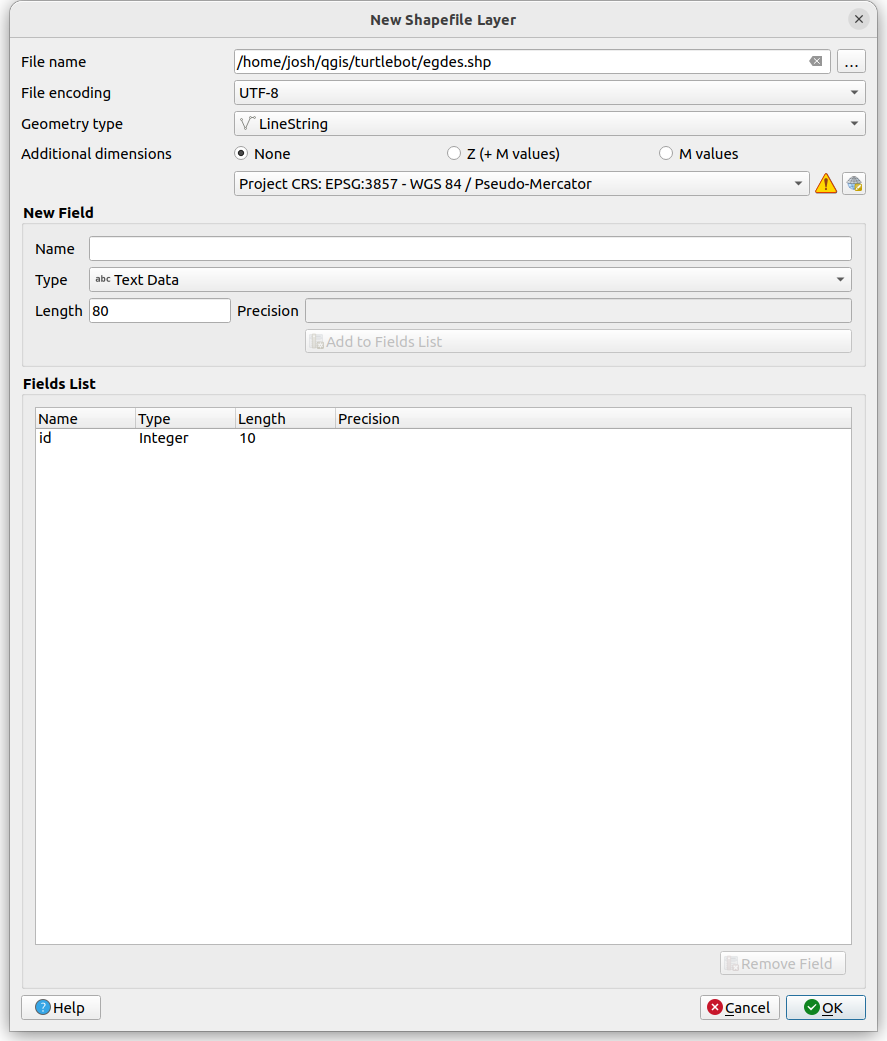
Select Layer -> Create Layer -> New ShapeFile Layer. Set the shapefile layer setting to be nodes for the File name, Point for the Geometry type and WGS 84/ Pseudo-Mercator for the coordinate system. Press OK.
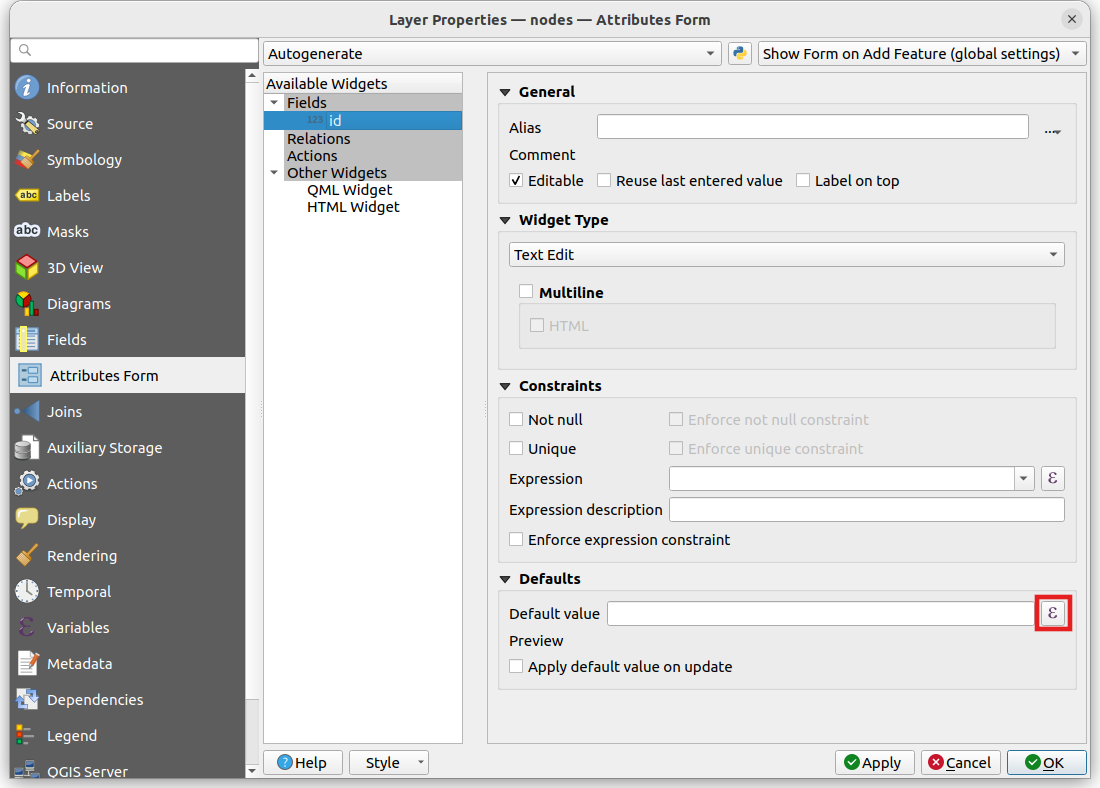
In order to have the id field auto increment, right click on the layer and select the Properties -> Attribute Form. Expand the Fields drop down menu and select id. Select the Expression Dialog icon which is across from Default value field.
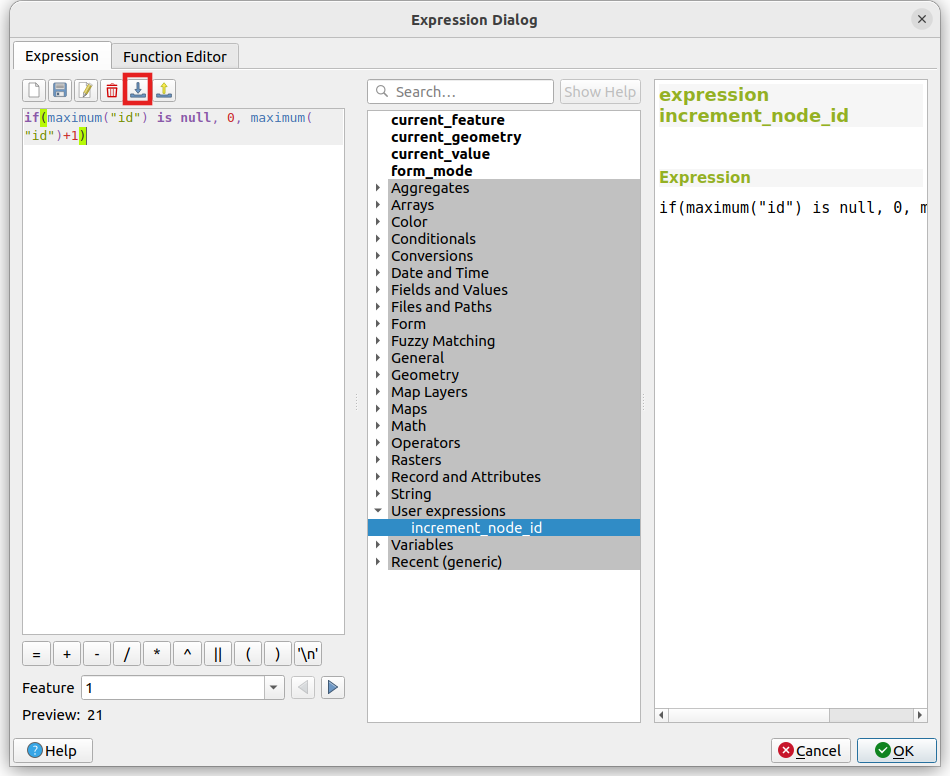
Within the Expression Dialog select Import user expressions and import increment_node_id.json which exists in the scripts file with the nav2 route module. Expand User expressions and double click on increment_node_id. The expression should show up in the left window. Click OK to save the expression and exit the Expression Dialog. Then click Apply and OK and save and exit the Attributes Form. This will increment the node id by one every time a new node is added. The first node id will be zero.
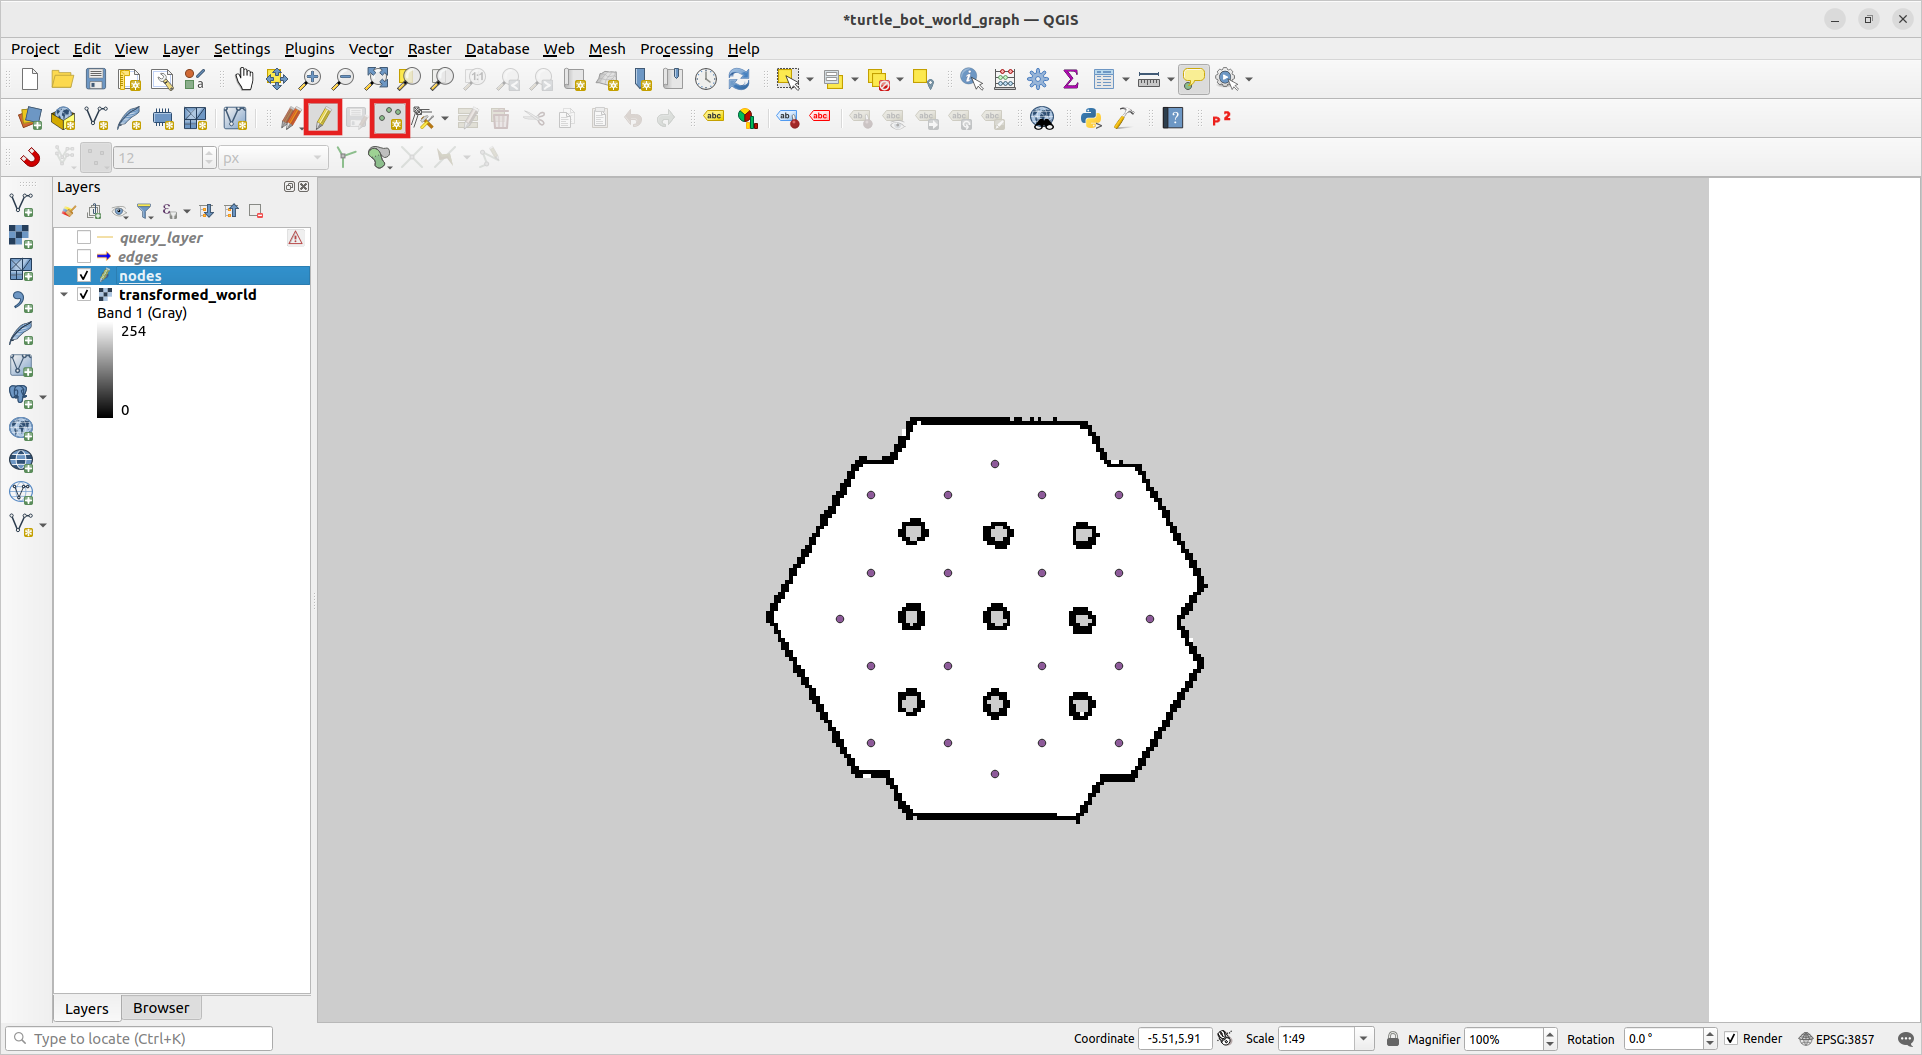
Click on the node layer and then select Toggle Editing icon represented as a pencil to start editing the layer. To add points, select the Add Point Feature. Start adding nodes by clicking in the main window. Each time a node is added, a window will pop up with the auto incremented id. Press OK to continue placing points. Once complete, unselect ‘Toggle Editing’ and save changes.
Note
By default, if a is node deleted the id list will not be updated. It is up to the user to determine how they wish to update the ids if individual or multiple nodes are deleted. Any node that is added will continue to increment based on the highest id, to ensure existing node are not automatically renumbered, breaking user implicit knowledge about the structure of the graph. This value can be overwritten by the user though the pop window after node placement or though the Attribute Table. To delete features in a layer right click on the layer and select Open Attribute Table. Click on Target Multi Edit Mode, select the features to delete, and click on the trash can icon.
4- Add Edges
Now an edge layer can be created. Select Layer -> Create Layer -> New ShapeFile Layer. Set the shapefile layer setting to be edges for the File name, LineString for the Geometry type and WGS 84/ Pseudo-Mercator for the coordinate system. Press OK. To auto increment the id field follow the same steps as above except replace increment_node_id.json with increment_edge_id.json. This will increment the edge id by one every time a new edge is added. The first edge id will be 10000.
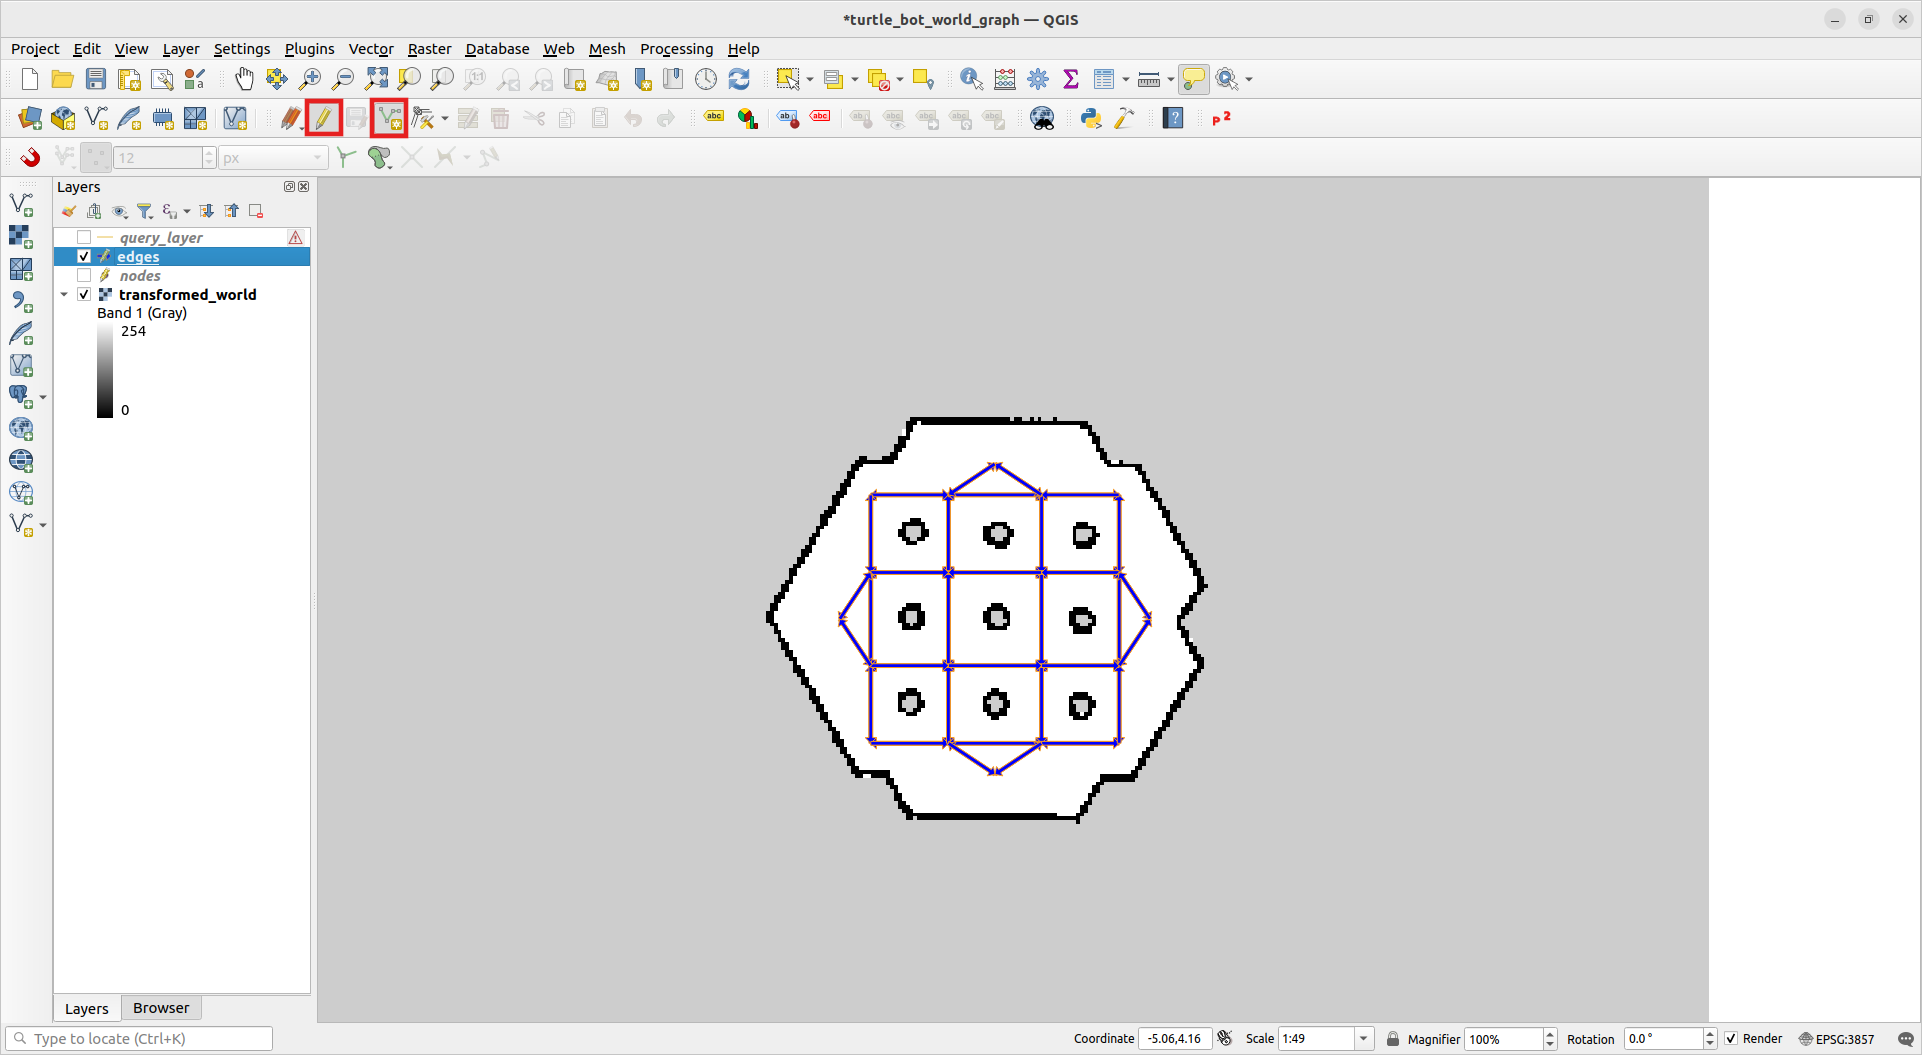
To see the directionality of the edges, right click on the edge layer and select Properties. Click Symbology -> Simple Line and change the Symbol layer type to Arrow. Click Ok. You should now be able to see arrows for each line string. Note that all edges in the route graph are directional, so if you want a bidirectional connection you should duplicate it in reverse.
Click on the edge layer and then on the Toggle Editing icon represented as a pencil to start editing the layer. To add edges, click on the Add Line Feature. Start adding edges by clicking twice in the main window. (First point is start, second point is end). Press right click anywhere when you have finished adding the two points for the prompt to save to come up. The edge locations must exactly match up to the node locations, so if Snapping is not already enabled by default, enable it via Views->Toolbars->Snapping Toolbar and depress the Magnet icon. Once complete, unselect ‘Toggle Editing’ and save changes.
5- Associate Nodes With Edges
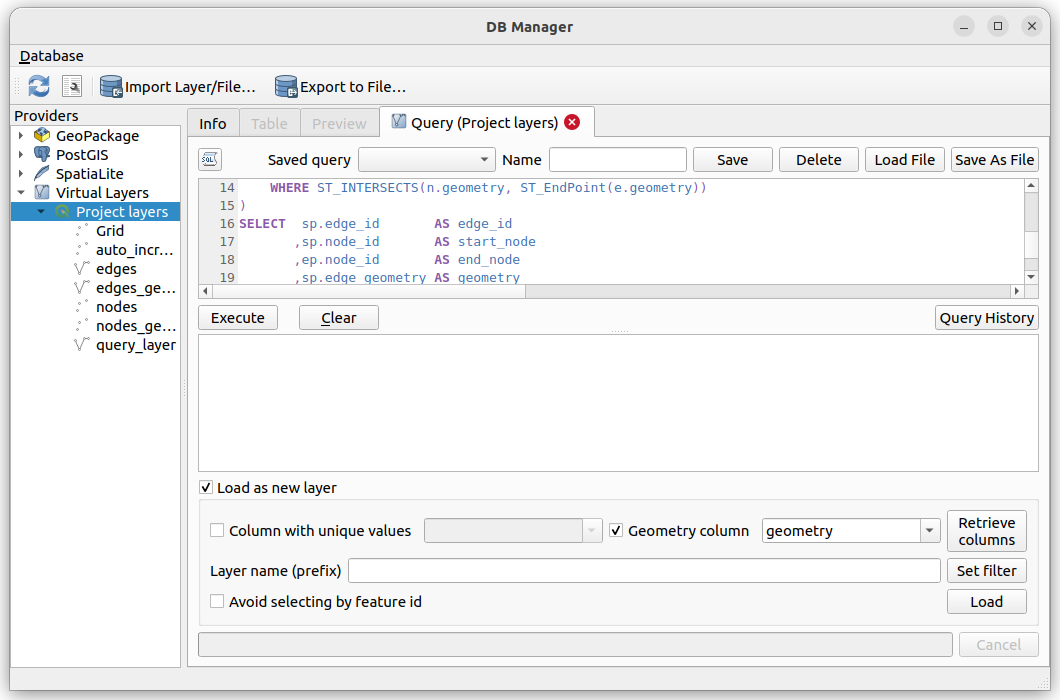
Now that we have our node and edge layers, we can associate node IDs with edge IDs. Select Database -> DB manager. Expand Virtual layers and expand Project layers. Open up the SQL window by clicking on the script icon in the top left corner. In the SQL window load in generate_start_and_end_id.sql by selecting Load File. The script can found within the scripts directory in the nav2_route module. Execute the script. Load the new layer by checking the Load as new layer box and clicking Load. The script associates the start and end of a line string by matching the node point. Then export the layer as a ShapeFile by right clicking on the layer selecting Export -> Save Feature As. Change the format to type to ESRI Shapefile, name the file, and verify that the coordinate reference system is WGS 84 /Pseudo-Mercator. Press OK.
6- Export To Geojson
We are now ready to export the node and edge layer as geojson files. Execute export_shapefiles.py <prefix_of_file> <path_to_edges_shapefile> <path_to_nodes_shapefile> within the scripts directory located in the nav2_route module. This script converts the nodes and edges shape file into a geojson file.
7- Congratulations
Your graph is ready to be consumed by the nav2 route! If you wish to add nodes or edges to your graph, edit the layers and repeat the process from step 5 to regenerate the graph. If you wish to adjust the graph, make sure Editing is toggled on for the node and edge layer. Then select Vertex Tool(all Layers) and toggle on Topological Editing. Repeat the process from step 5 to regenerate the graph.
Happy Routing!