SWAGGER Route Graph Generation
Overview
This tutorial walks a user through generating a graph for the nav2 route server using NVIDIA’s SWAGGER.
Requirements
Follow https://github.com/nvidia-isaac/SWAGGER/ to install SWAGGER using the installation instructions in the README.
Tutorial Steps
1- Generate SWAGGER Graph
The first step is to generate a swagger graph from a raster image of the map.
This can be done by running the generate_graph.py script located in the scripts.
This will output two files, a graph.gml which contains the graph structure and a graph.png which shows a visualization of the graph overlaid on the rastered image.
python scripts/generate_graph.py \
    --map-path <path_to_map.png> \
    --resolution <meters_per_pixel> \
    --safety-distance <meters> \
    --output-dir <output_directory>
The resolution should be set as the same as in your SLAM session that generated the occupancy grid map. The safety distance is the minimum distance away from any obstacle that the graph will be generated. When completed, the output should look similar to the following:
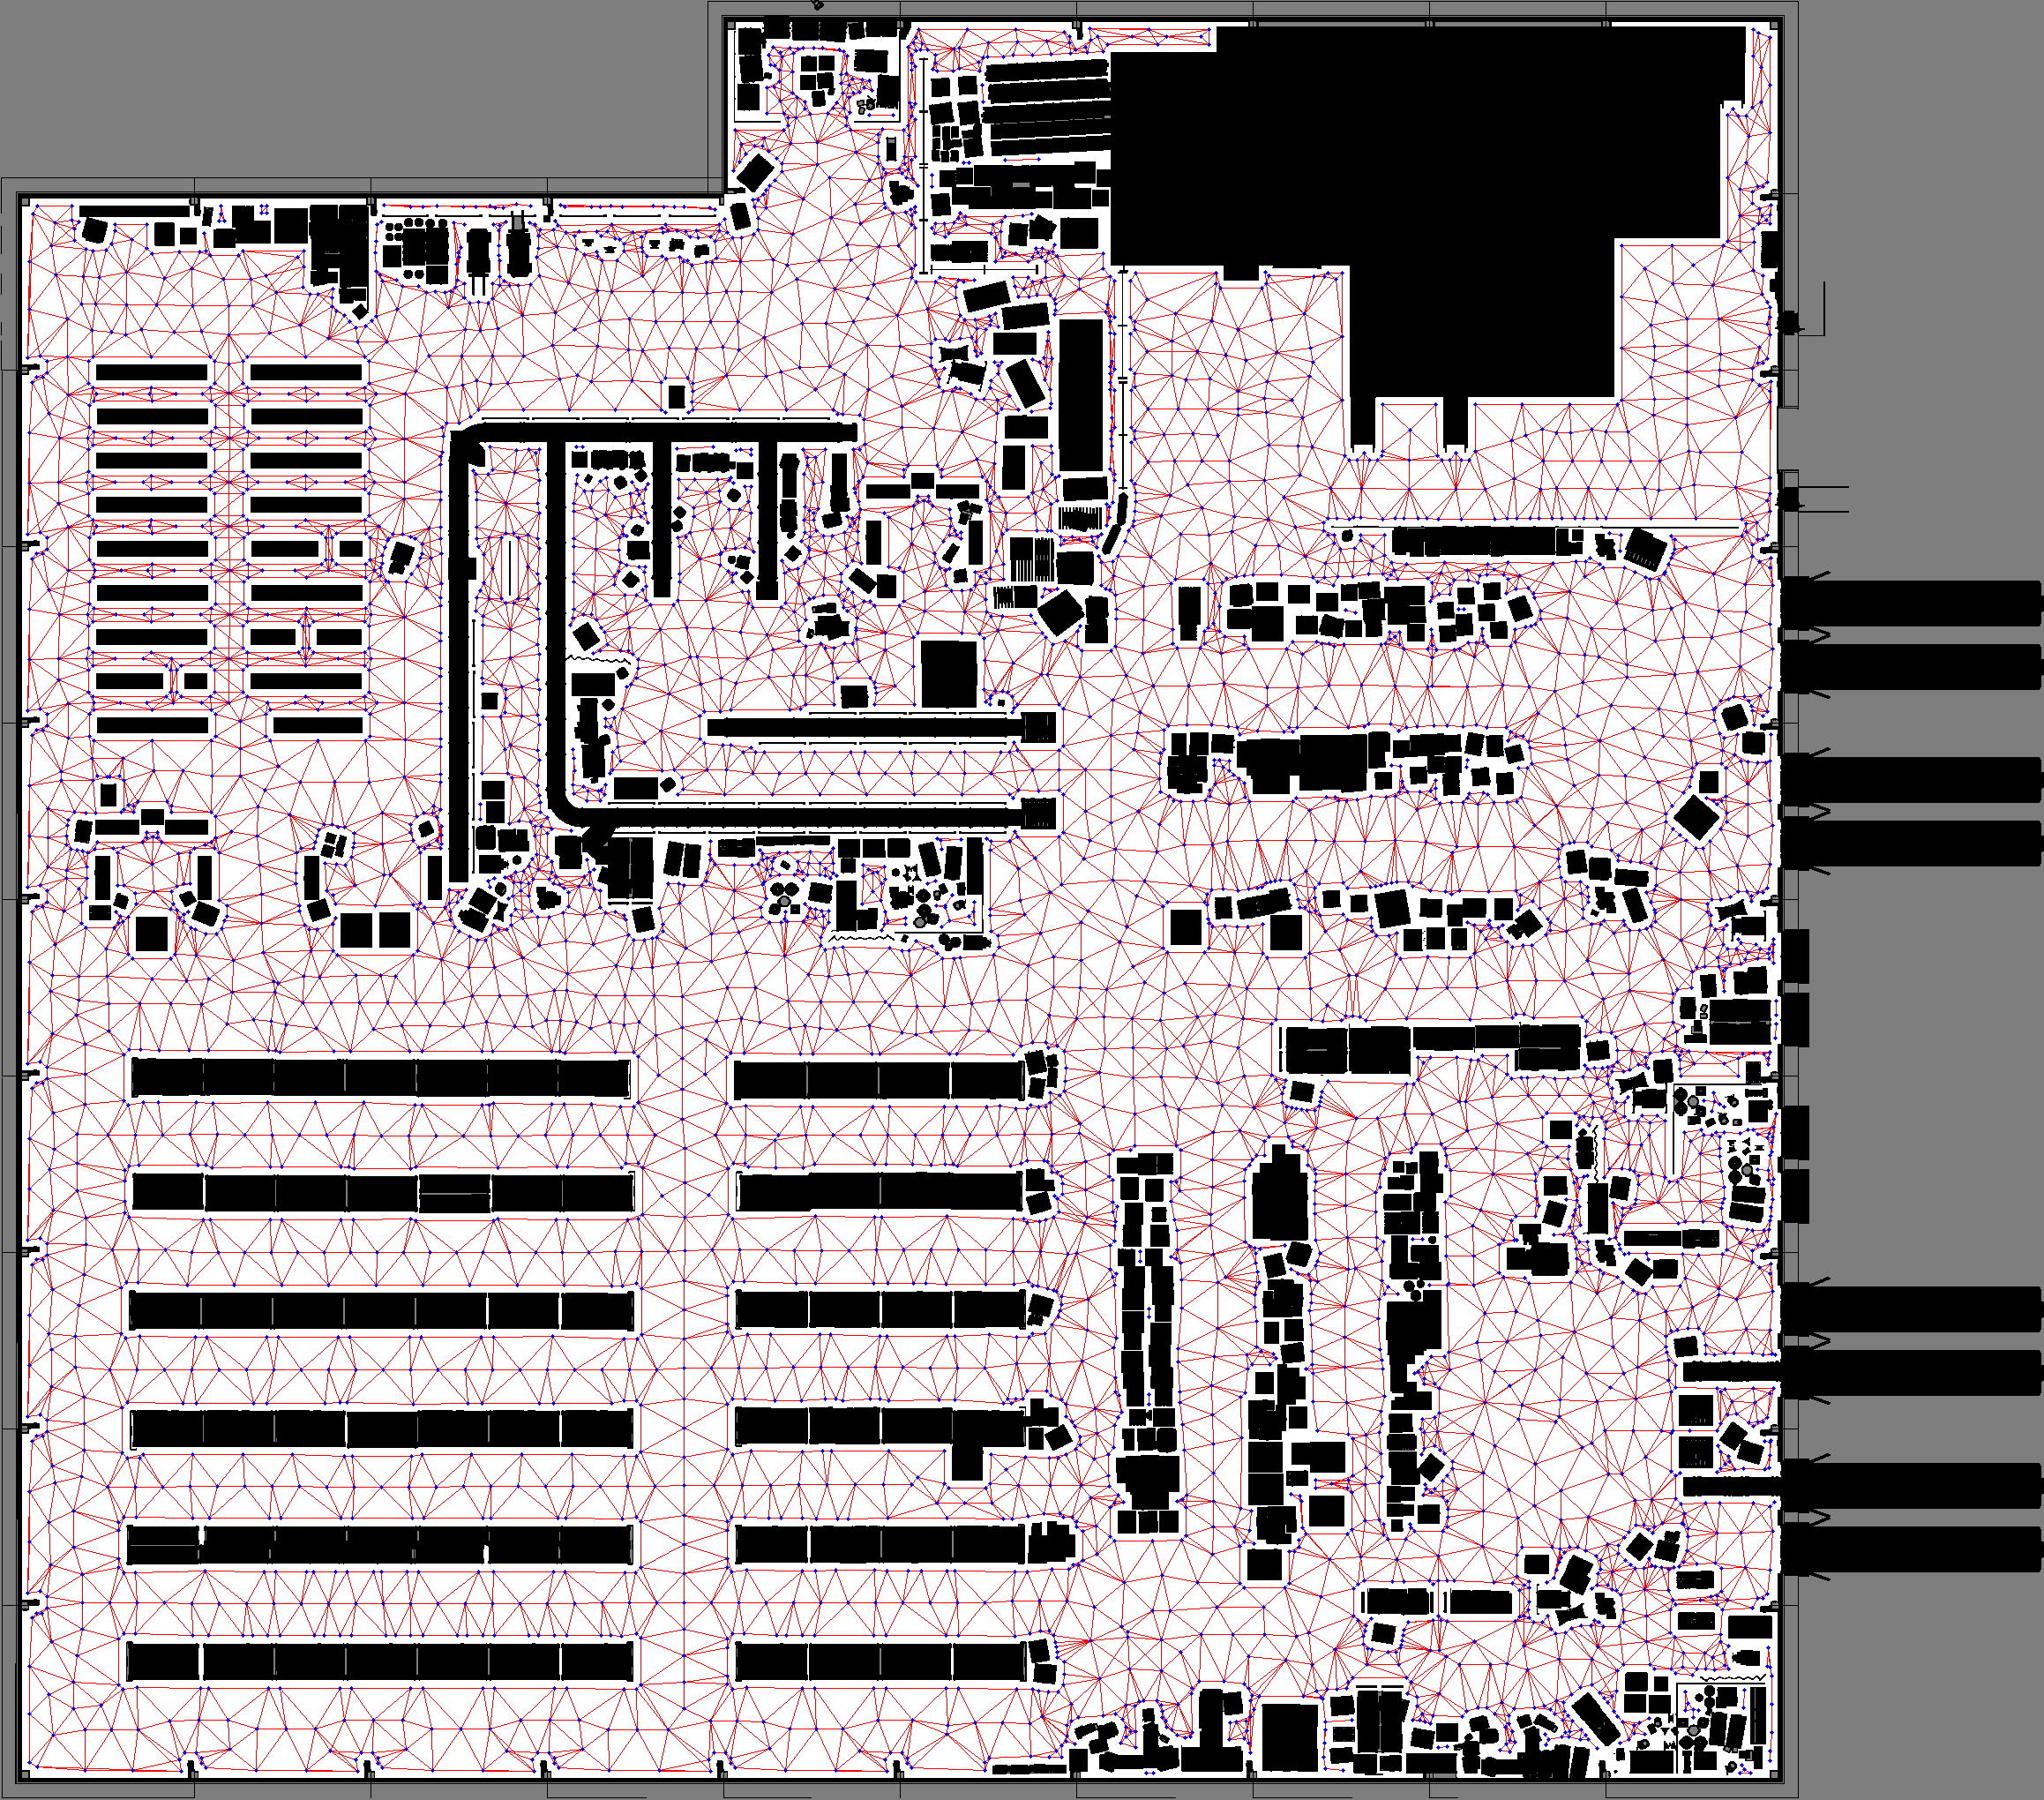
This process is performed by:
Convolving the rastered image by the safety distance to create a safety mask.
Skeletonizing the safety mask to create a skeleton of the map.
Adding boundary nodes around the convolved obstacles.
Placing nodes in the center areas of the map to fill space.
Connecting edges to skeleton, center, and boundary nodes and pruning those which do not add value.
2- Convert to GeoJSON
To work with this graph in Nav2 Route, we need to convert this to a format the Nav2 Route Server can interpret.
The SWAGGER graph format is a GML file, which is not directly usable by Nav2 Route.
Rather than creating new specialized parser plugins for Route Server, we will convert the GML file to GeoJSON format using a conversion script.
This script is located within the integrations/nav2/tools directory of SWAGGER.
It can be run as follows:
python integrations/nav2/tools/gml_to_geojson.py <path_to_graph.gml>
The output will be a graph.geojson file in the same directory as the input GML file.
This conversion populates the GeoJSON with the key information about the graph and ensures that each edge are bidirectional for navigation purposes.
4- Demonstration
For demonstration, we’re going to use the Large Warehouse map provided by SWAGGER.
This map can be found in the maps directory of the SWAGGER repository.
You can run the following command to generate the graph and convert it to GeoJSON:
python scripts/generate_graph.py \
    --map-path maps/large_warehouse.png \
    --resolution 0.05 \
    --safety-distance 0.2 \
    --output-dir graphs

python integrations/nav2/tools/gml_to_geojson.py graphs/graph.gml
Then, we’ll create a large_warehouse.yaml for the map so that we can load it into the map server:
image: large_warehouse.png
mode: trinary
resolution: 0.05
origin: [0.0, 0.0, 0]
negate: 0
occupied_thresh: 0.65
free_thresh: 0.25
Update the BT Navigator parameters in your Nav2 params to use a graph-based navigator for this demonstration:
bt_navigator:
  ...
  default_nav_to_pose_bt_xml: $(find-pkg-share nav2_bt_navigator)/behavior_trees/navigate_on_route_graph_w_recovery.xml
  ...
Finally, launch Nav2’s Loopback simulator bringup, which uses a simple backend kinematic simulator for R&D and high level testing purposes, to avoid having to create a custom Gazebo or Isaac Sim simulation for this map:
ros2 launch nav2_bringup tb4_loopback_simulation_launch.py map:=/path/to/your/map.yaml graph:=/path/to/your/graph.geojson
Happy Routing!